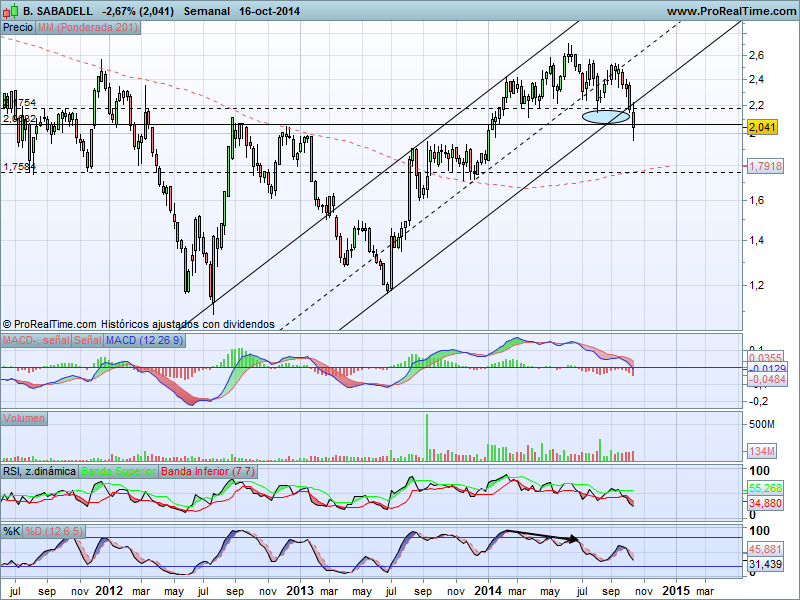
Monthly chart reflects the consistent bearish trend in the stock. Stochastic and macd bearish, huge volume in the red candlestick by the end of october that the next candle is not able to overtake. Bad signs all of them.
Weekly chart speaks about the chance to visit the targets 12,40 and 14,80 once completed the fibonacci backard movement. Oversold indicators also point to the possibility of seeing the rebound.
Bearish indicators in daily chart introduce the idea of testing 10,60 again before the expected weekly rebound.
Lifevest.


